
By John Evans and Tyler Fertel* –
It’s been a decade since we first reported early statistics on design patent IPR/PGR outcomes. Time for an update—and the numbers tell an interesting story. Design patents remain notoriously hard to challenge, with a historical institution rate of just 37%. That’s roughly half the rate for utility patents (at least before recent downward shifts). But here’s the twist: once instituted, design patent claims fall at about the same rate—69%—as utility patents in all-claims-unpatentable FWDs.
We pulled all design patent IPR/PGR institution and final written decisions from Docket Navigator (2013–present) to compile these statistics. Here’s what we found.
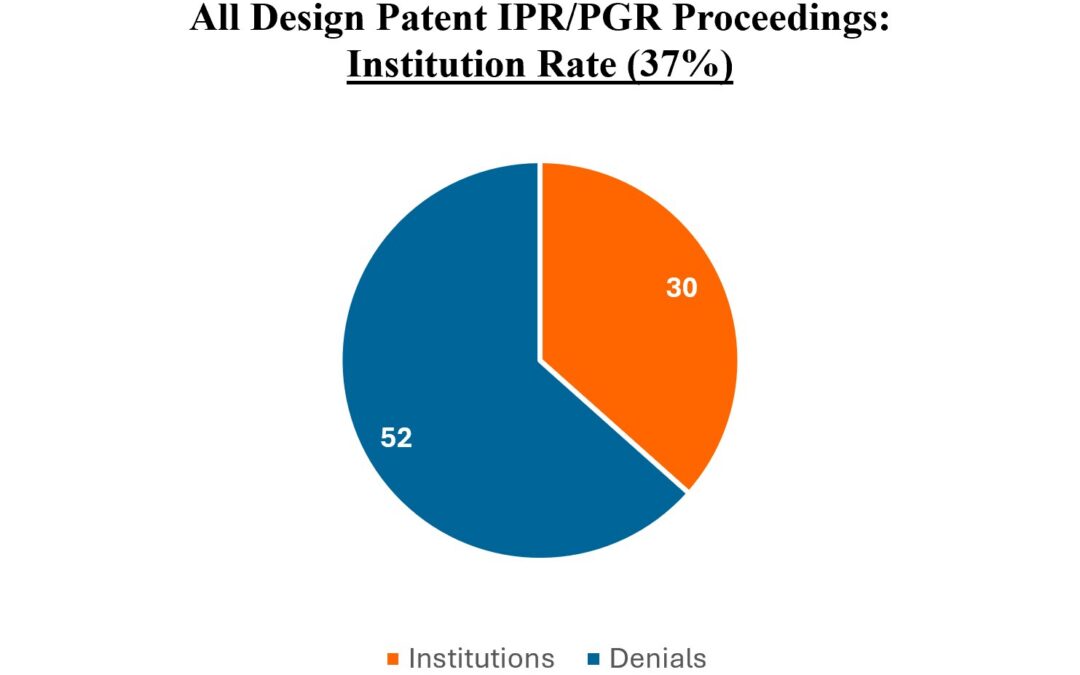
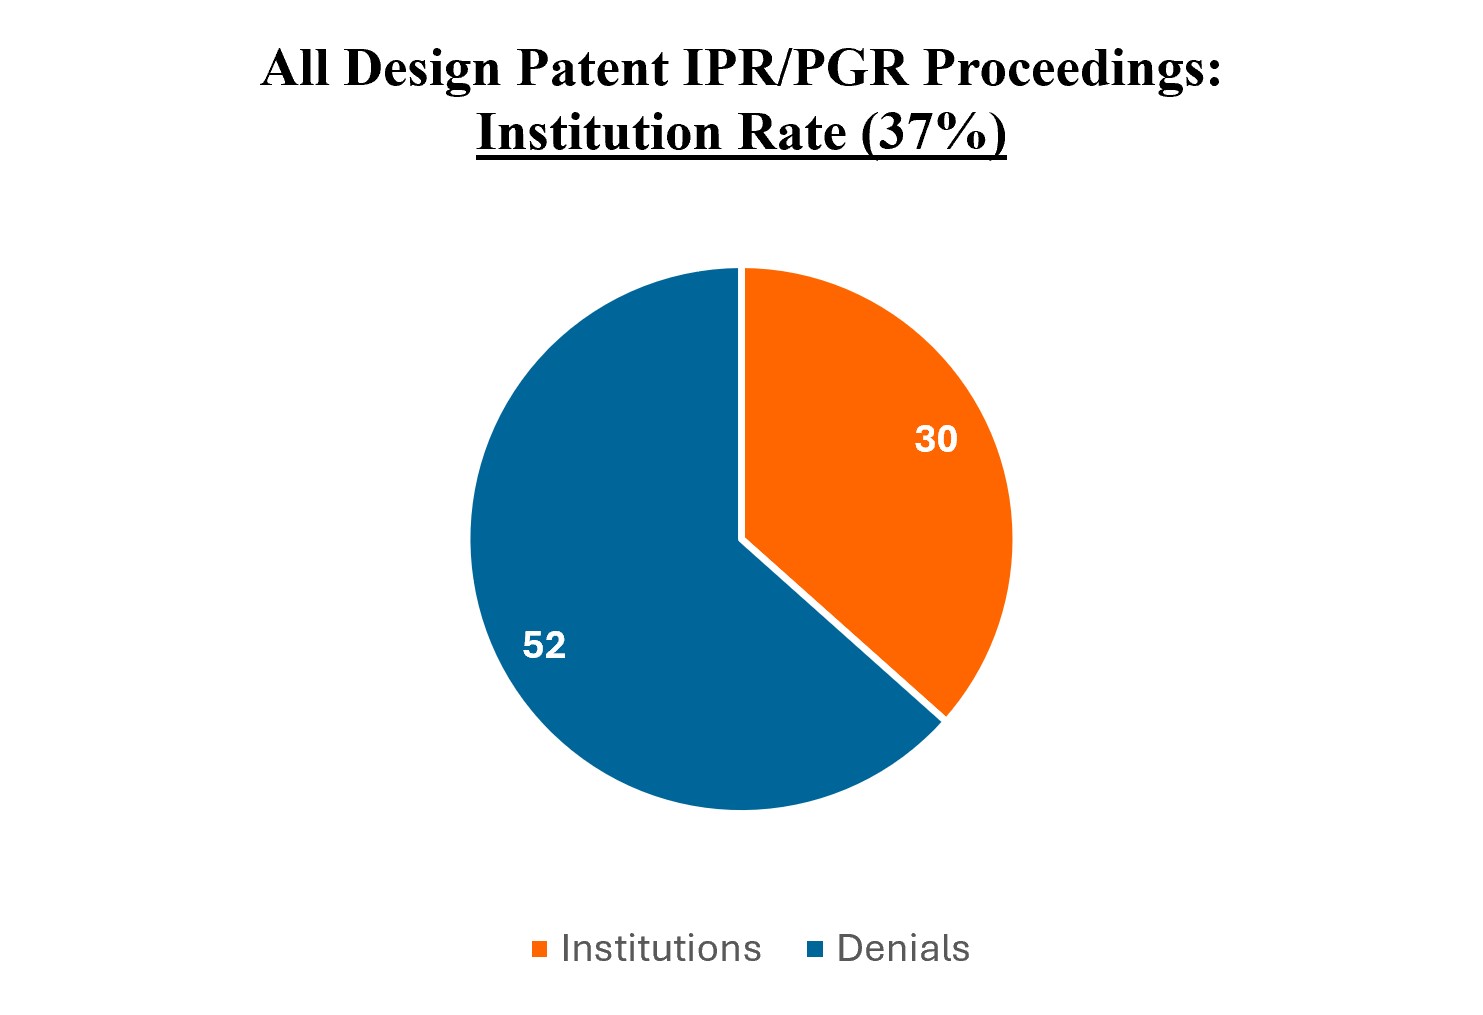
Institution: The Big Hurdle (2013-present). Of 86 design patent IPR/PGR petitions filed since 2013, 82 resulted in institution decisions. Only 30 were instituted, 52 were denied. That’s an institution rate of about 37%:
How does that compare to utility patents? Historically, utility patent rates hovered between 60-70%, including 56-67% (FY2020-2024) and 68% (H1 2025). In the discretionary denial era, overall institution rates have dropped sharply—as low as 43% (May 2026). So the gap is closing. Recent utility patent institution rates are converging with design patents’ historical 37%—perhaps reflecting a broader tightening of the Board’s patentability analysis at the institution stage across-the board.
Why have institution rates for design patents been so low? Two main reasons: (1) the strict visual similarity standards make anticipation and obviousness arguments difficult, and (2) design patents have only one claim, making institution an all-or-nothing proposition. Utility patents, with multiple claims, should theoretically pass the institution gate more easily because petitioners need only show one claim is reasonably likely unpatentable.
Final Written Decisions: The Playing Field Levels Out (2013-present). Of 26 instituted design patent IPR/PGR proceedings that reached FWD, 18 ended with the claim found unpatentable; 8 challenged claims survived. That’s a 69% unpatentability rate:
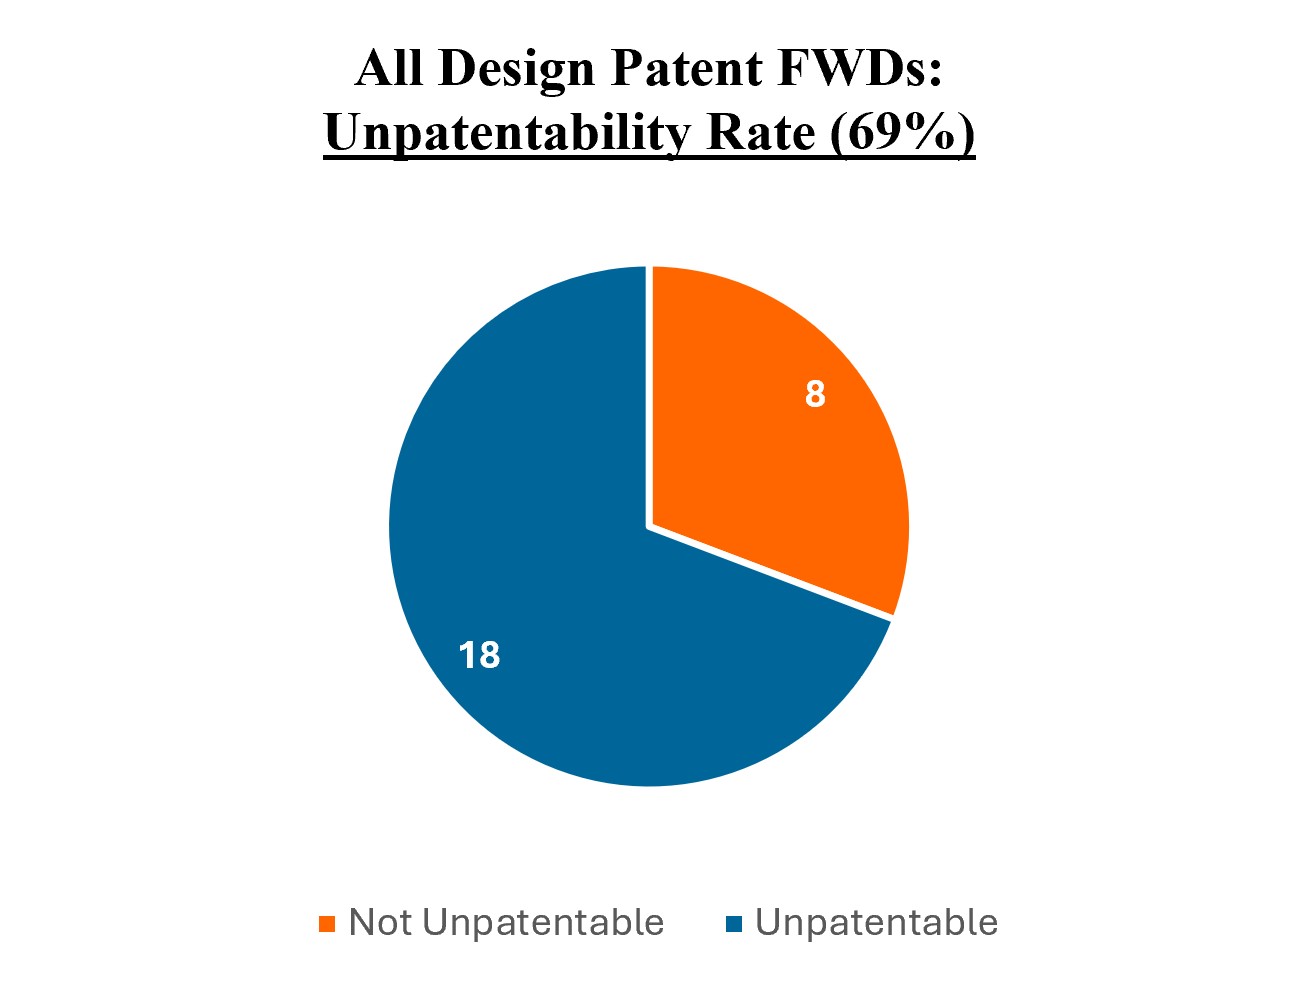
That 69% tracks utility patent outcomes. In FY 2025, the PTAB reported an all-claims-unpatentable rate of about 65%. (Mixed-outcome FWDs—where at least one claim falls—run higher, around 80–85%.) This convergence makes sense. Because design patents have only one claim, a 69% unpatentability rate is an all-claims-unpatentable rate. Once you clear institution, the odds look similar regardless of patent type.
The Bottom Line. Design patents have been tough targets at the PTAB. Institution is the real battleground—rates run roughly half those for utility patents, historically-speaking. But petitioners who clear that hurdle succeed on the merits at about the same clip as everyone else. As discretionary denials continue to reshape the PTAB landscape, design patent challenges may offer a useful benchmark for how the Board is evaluating patentability—especially at the outset.
* Tyler is a Summer Associate in Jones Day’s Cleveland Office.
Latest posts by John Evans, Ph.D. (see all)
- Design Patents at the PTAB: Over a Decade of Data Reveals the Real Odds - July 23, 2026
- Chief Judge Signals Changes May Be Coming for the Ordinary Observer Test - March 12, 2026
- Show Me the Evidence: Primary References Still Required after LKQ - October 3, 2025